The Ministry of Education released a checkup of school districts across the province this week, laying out visuals on graduation rates, socio-economic vulnerabilities, classroom readiness, FSA success, and more in an online, searchable tool.
Chilliwack’s data shows that First Nation students are succeeding more every year, but that overall graduates are feeling less prepared for post-secondary and the workforce.
And while it shows that Grade 4 students are well prepared for their skills assessment tests, it shows that Grade 7s are falling behind.
Here is some of the data found for Chilliwack:
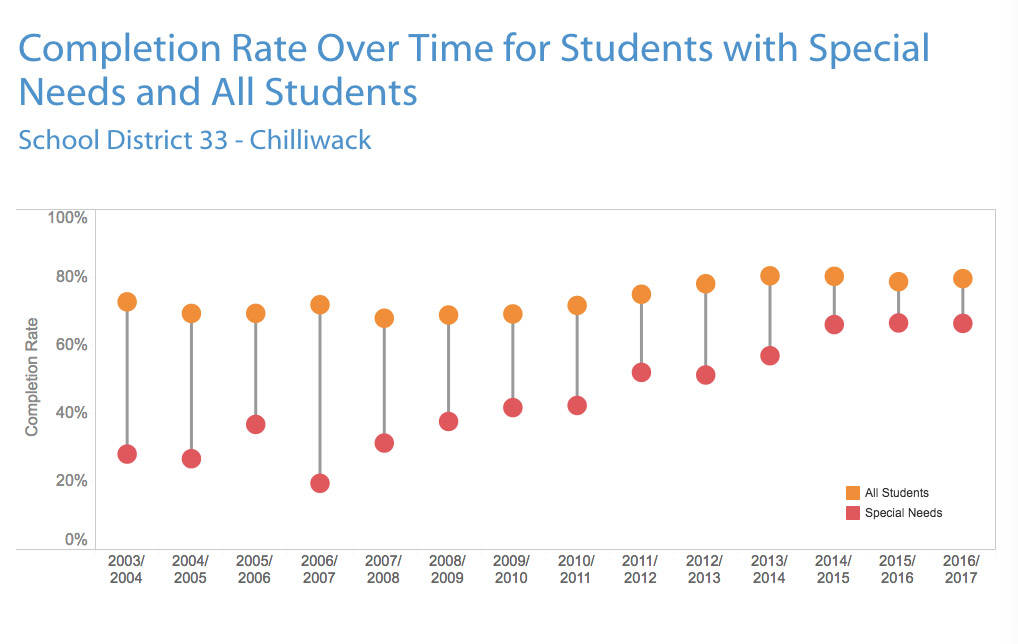
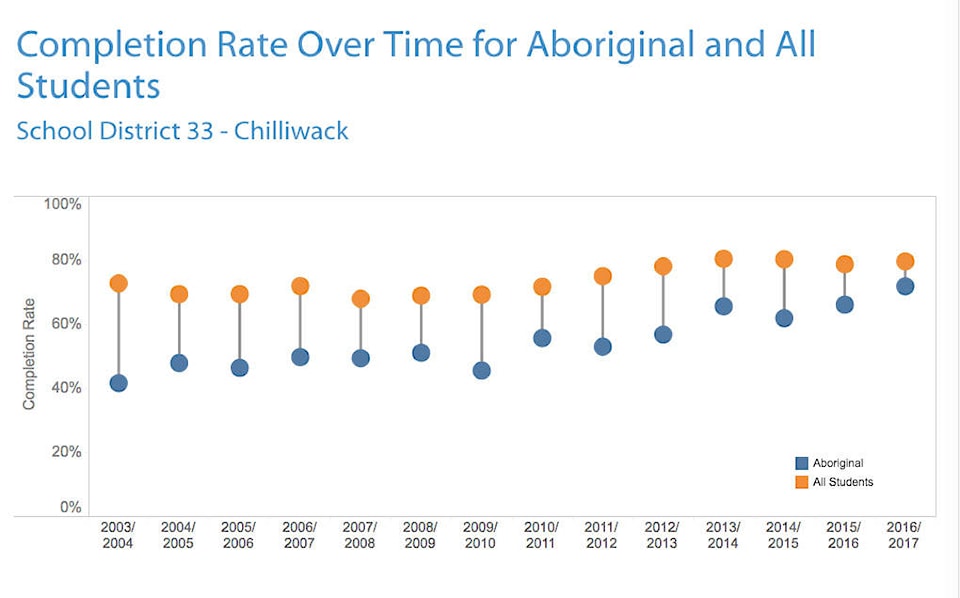
Completion rates
The gap is closing between aborginal and non-aboriginal students, and special needs and non-special needs students.
Completion rates on the average haven’t changed much in Chilliwack, sitting at about 80 per cent consistently over the past five school years. But when the data pulls out the aboriginal and special needs graduation rates, it shows that both of those student populations are doing much better in terms of completion, in comparison to past years and when compared against the provincial averages.
While the study does not provide exact data, instead opting for easy-to-read visuals, it’s clear to see that gains are being made. In 2003/2004, the chart shows about a 28 per cent completion rate for special needs students compared to a 75 per cent overall completion rate. Last year, special needs students had about a 60 per cent completion rate in Chilliwack, about average for the province.
READ MORE: B.C. high school completion rate continues to rise
Foundation Skills Assessments
Love them or hate them, schools still chart student progress in the basics (reading, writing, and numeracy) with the Foundation Skills Assessment in Grades 4 and 7.
Last year showed some good news for Grade 4 students, with scores coming in at the top end of the past five years for Chilliwack, and higher than provincial averages. But the opposite was true for most of the Grade 7 test results, which saw students scoring at the bottom end of the five-year spectrum for Chilliwack, and below the provincial average. The outlying group in Grade 7 was the special needs students, who scored better than previous years in reading skills.
But there is a lot of information to unpack from the FSAs, including tracking students from their Grade 4 to Grade 7 year. The assessment is also affected by how many students miss the tests, and numerous other factors.
Job readiness
Are today’s graduates ready for tomorrow? It depends who you ask.
About half of last year’s Grade 10 students (443 responses) said they were satisfied that school is preparing them for post-secondary education. Only about 40 per cent of the same group felt the same way about a job in the future.
But when the data singles out aboriginal Grade 10 students, the number of students confident about the future plummets, with about 33 per cent (61 responses) satisfied school is preparing them for post-secondary school and 30 per cent prepared for a job.
Last year’s Grade 12 classes were asked the same questions, and the confidence dropped further.
Overall, about 43 per cent of graduates (363 responses) were satisfied they were prepared for post-secondary school, and 25 per cent satisfied they were prepared for a job in the future.
The percentage of aboriginal students feeling prepared for post-secondary was about the same, with 42 responding. But only about 20 per cent of aboriginal students in Chilliwack reported feeling confident that school has prepared them for a job in the future. At one point in the past five years, that level of confidence was over 50 per cent.
Socioeconomics
There are a higher percentage of people ages 25 to 54 in Chilliwack without post-secondary credentials (44.7%) than in the province overall (35.2%).
The rate of single parent families is about the same as the provincial average of 15.3 per cent, sitting at 15.9 per cent. The study does not specify those families as having a mother, father, grandparent or other caregiver as the lone parent.
The average family income in Chilliwack is considerably lower than the provincial average of $91,967. In Chilliwack, the average is $78,692.
Forecasts
While student enrolment in Chilliwack has never toppled over the 14,000 mark, the forecast for the next 14 years is a steady increase from that number to almost 16,000.
The largest grade group this year is the Grade 11 class, with 1,595 students. Of that class, 171 are identified as aboriginal and 156 as special needs. The smallest grade group is the kindergarden class, with just 1,119 students right now. Of those, 140 identify as aboriginal and 37 as special needs.
Aboriginal (self identified) and special needs students (assessed) are the only student populations tracked by the district.