Chilliwack is changing demographically as it grows.
Anyone who may be curious about population, housing, education or diversity stats for example, can check out some user-friendly summaries put together by the City of Chilliwack.
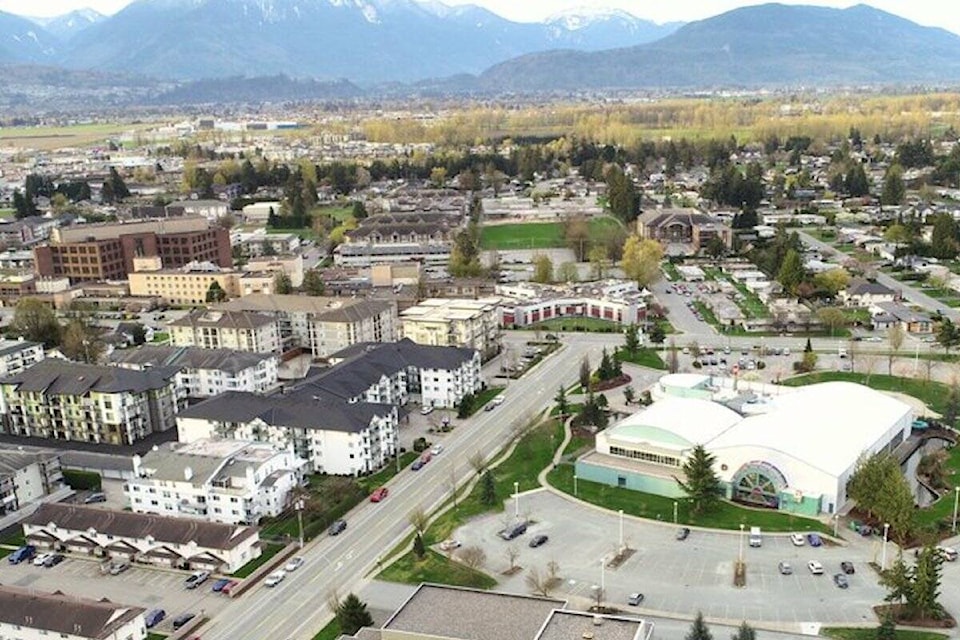
They’ve created statistical profiles for all of Chilliwack neighbourhoods, and other graphs based on the 2021 Census numbers from Statistics Canada. There are city-wide profiles and a community trends profile with data presented visually.
A quick look at the population breakdown for Chilliwack neighbourhoods, Chilliwack proper, which includes downtown and Kwa’kwa’apilt is the largest by population on its own, with 31,400 people, or 31 per cent of the total, as of the 2021 census which was 100,400.
But if you add Vedder (22,620) and Sardis (10,010) and Promontory (11,820) that bypasses the Chilliwack proper total.
Are you interested in learning more about your community? Our Neighbourhood Demographic Profiles are now available! For more information on Chilliwack's population, housing, diversity and more, visit https://t.co/khba0TUgUh pic.twitter.com/GhEe4NVH79
— City of Chilliwack (@City_Chilliwack) April 23, 2024